Numerical Modeling

AN EXPLICIT ONE-DIMENSIONAL TIME-DEPENDENT TILTING CLOUD MODEL
An explicit one-dimensional time-dependent tilting cloud model has been developed for use in cumulus parameterization. The tilting axis is not necessarily orthogonal to the (r, ) plane, making the horizontal axisymmetric assumption more reasonable. This explicit time-dependent tilting model (ETTM) consists of an updraft and a downdraft which are governed by the same dynamic and thermodynamic equations. The updraft is initiated by a moist thermal bubble, while the downdraft is consequently induced by evaporative cooling and the drag force of precipitation separating from the tilting updraft instead of arbitrarily initialized.The updraft is capable of reproducing the major features of a deep cloud such as overshooting cooling above the cloud top, evaporative cooling near the surface, and drying in the lower atmosphere at dissipating stages. The entrainment/detrainment rate in this model is well-defined, and its time variation is quite significant. Moreover, the vertical profile of the air inside the updraft does not follow the moist adiabat after deep convection. For the downdraft, the total precipitation and mass flux at low levels contributed from the downdraft cannot be neglected in our case study. In addition, the downdraft can bring dry air from middle levels to lower levels.Three sensitivity tests – the environmental sounding, the tilting angle, and the radius of the updraft/downdraft – have also been conducted. The cooling/warming of a downdraft near the surface is sensitive to the environmental sounding, consistent with results from Srivastava. The cloud life span, maximum vertical velocity, precipitation amount, and vertical mass flux are strongly influenced by the tilting angle and the radius of the cloud.
Figure Above: The schematic structure of the updraft (U) and downdraft (D) in the tilting cloud. E indicates environment. Ri is the ratio of precipitation remaining in the updraft. Thick gray dashed lines denote precipitation.
Figure Above: Time variation of the (a) vertical velocity (ms-1), (c) potential temperature anomaly (K), and (e) moisture anomaly (kg kg-1 from the updraft. (b), (d), and (f) are the same as (a), (c), and (e), respectively, except from the downdraft. The values in (e) and (f) are multiplied by 1 x 10³.
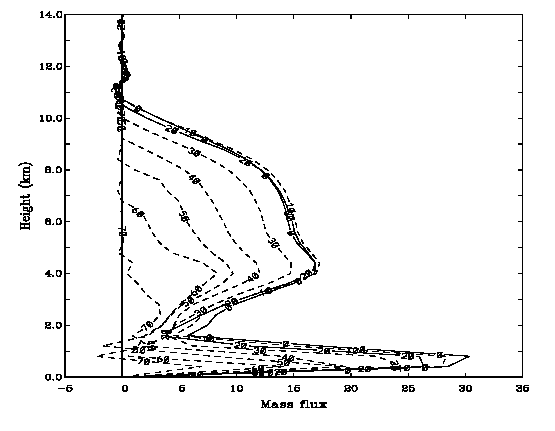
Figure Above: The vertical distribution of total mass flux (×1010 kg) from the updraft (line U), downdraft (line D), and both (line T) within 60 minutes.
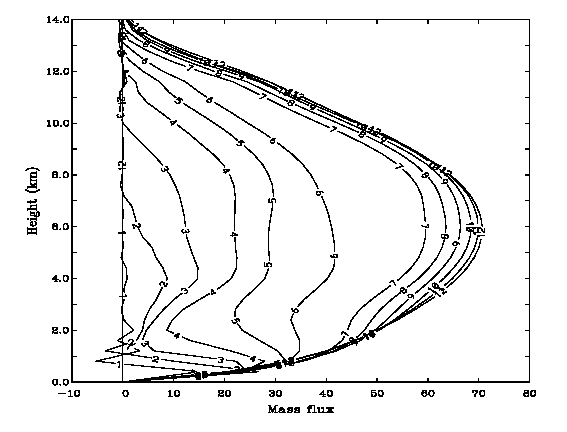
Figure Above: The vertical distribution of total mass flux (×1010 kg) from both updraft and downdraft within 60 minutes with different tilting angles. The number indicates the tilting angle in the unit of degree. The profiles with the tilting angles of 0o and 20o are plotted with solid lines.
Figure Above: The vertical distribution of total mass flux (×1010 kg) from both updraft and downdraft within 60 minutes with different radii of the updraft. The number indicates the radius in the unit of km.


APPLICATION OF THE MULTIGRID METHOD AND A FLEXIBLE HYBRID COORDINATE IN A NONHYDROSTATIC MODEL
A fully compressible, three-dimensional, nonhydrostatic model is developed using a semi-implicit scheme to avoid an extremely small time step. As a result of applying the implicit scheme to high-frequency waves, an elliptic partial differential equation (EPDE) has been introduced. A multigrid solver is applied to solve the EPDEs, which include cross-derivative terms due to terrain-following coordinate transformation.Several experiments have been performed to evaluate the model as well as the performance of the scheme with respect to tolerance number, relaxation choice, sweeps of prerelaxation and postrelaxation, and a flexible hybrid coordinate (FHC).An FHC with two functions (base and deviation functions) is introduced. The basic function provides constant vertical grid spacing required in the multigrid solver, while the deviation function helps to adjust the vertical resolution.
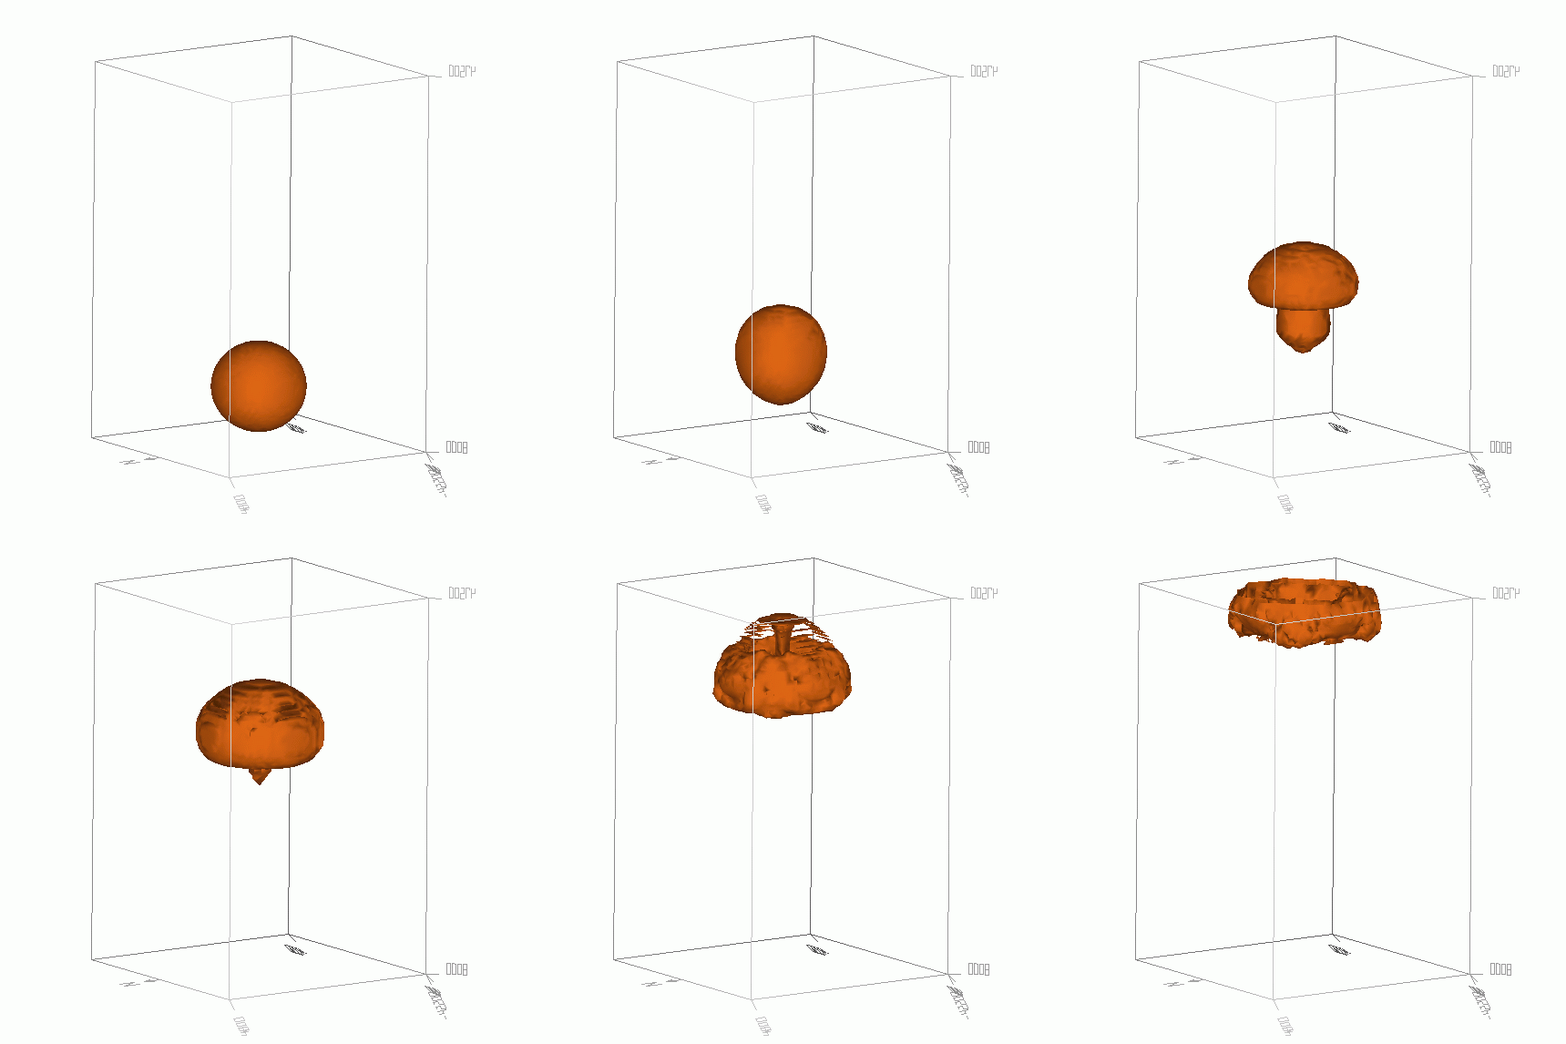
Figure Above: The time evolution of the three-dimensional thermal bubble. The isotropic potential temperature perturbation of 0.07 K is plotted. The domain size is 980, 980, and 1600 m in the x, y, and z directions, respectively.

WRF PHYSICS

under construction