Data Assimilation

APPLICATION OF SSM/I SATELLITE DATA TO A HURRICANE SIMULATION

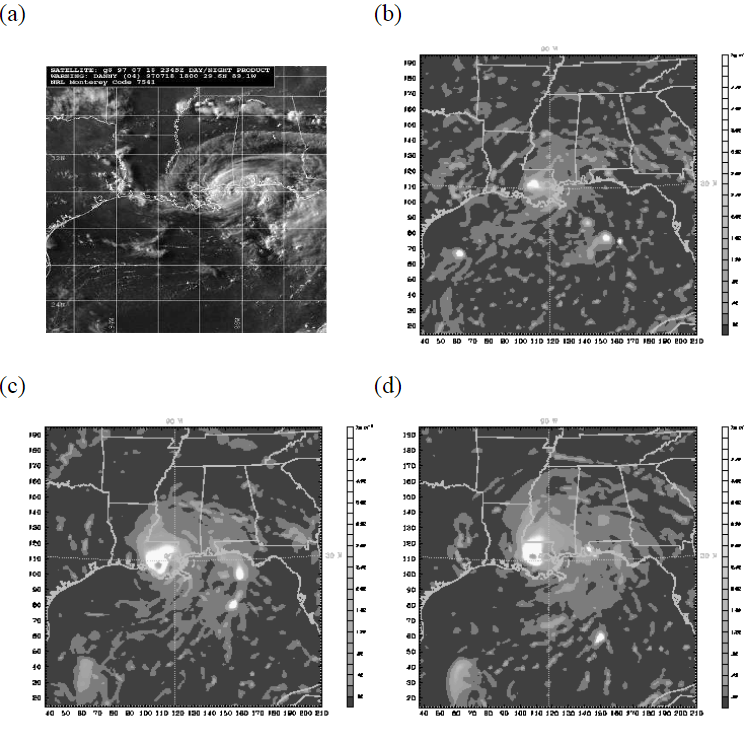
The impact of the Special Sensor Microwave/Imager (SSM/I) data on hurricane Danny simulations is assessed. The assimilation of SSM/I data is found to (1) increase the atmospheric moisture content over the Gulf of Mexico; (2) strengthen the low-level cyclonic circulation; (3) shorten the model spin-up time, and (4) significantly improve the simulation of the storm.s intensity. Two different approaches of assimilating SSM/I data, namely assimilating retrieved products and assimilating raw measurements, are further compared. The data assimilation analyses from these two approaches give different moisture distributions in both the horizontal and vertical directions in the storm’s vicinity, which may potentially affect the simulated storm’s development; however, the simulated storm intensities are considered comparable for the Danny case. From sensitivity tests performed in this study, it is also found that the choice of the observational error variances could be potentially important to the model simulations.

watervapor_a-d
Fig Above: The differences of the (a) vertical integration of water vapour (kg m-2) and 950 hPa wind vectors and (c) vertical cross section of water vapour mixing ratio (g kg-1) along the line AB in (a) between RV and CONTROL cases at 00 UTC 17 July 1997. (b) and (d) are the same as (a) and (c), respectively, except for the differences between TB and CONTROL cases. RV: assimilates retrieved SSM/I total precipitable water and sea surface wind. TB: assimilates SSM/I raw measurements (i.e., brightness temperature). CNTL: didn’t assimilate any data.
Fig Above: The observed sea level pressures (hPa) at the storm center (solid line; OBS) and 48-hr model simulations from 0000 UTC 17 July to 0000 UTC 19 July 1997. The NCEP Global Data Assimilation System (GDAS) data are used for boundary conditions, initial conditions, and 3DVAR first guess. The dashed-dotted line indicates a run which did not assimilate any data (CONTROL run); the long-dashed line indicates a run which assimilated SSM/I raw measurements (TB); and the dotted line indicates a run which assimilated retrieved SSM/I products (RV).


rainloop_crop
Fig Above: The first 12 hour accumulated rainfall. The left pannel is the run which does not assimilate any observational data, and the rainfall onsets after a 9-h simulation. The middle pannel is the run which assimilates retrieved total column water vapor and sea surface wind speed, and the rainfall onsets after a 2-h simulation. The right pannel is the run which assimilates brightness temperature, and the rainfall onsets after a 1-h simulation.


Fig Above: (a) Visible satellite image from GOES-8 at 2345 UTC 18 July 1997 (courtesy United States Naval Research Laboratory), and vertical integration of cloud water, ice, rain, and snow for (b) CONTROL, (c) RV, and (d) TB cases at 00 UTC 19 July.


ASSESSMENT OF RETRIEVED GPS PRODUCTS USING AN ABSERVING SYSTEM SIMULATION EXPERIMENT

Using a high-resolution mesoscale model with an Observing System Simulation Experiment (OSSE) approach, it is found that retrieved refractivity might be underestimated and its uncertainty in the lower troposphere can reach about 10 units under the assumption of locally spherical symmetry. From a sensitivity study, we also found that refractivity is very sensitive to the low-level moisture field and to a lesser extent, the low-level temperature field. Both findings provide possible evidence that assimilating retrieved refractivity might introduce errors in pressure, temperature, and moisture in the 3DVAR analysis, and these errors are comparable to errors imbedded in the mesoscale model initial condition, which might lead to significant uncertainty in a high-resolution mesoscale model forecast.